
Ozone Bioindicator Plants
High levels of air pollution can be harmful to forest trees. Polluted air can sometimes travel very long distances, possibly affecting forests far from the urban areas that contain the major pollution sources. Ozone pollution can reduce tree growth, affect tree species composition, and make some trees more vulnerable to certain pests (Chappelka and Samuelson 1998). Ozone can also cause direct injury to the leaves of many species.
FHM developed a biomonitoring method to monitor ozone stress on forests. Bioindicator plant species are selected because they are known to be sensitive to ozone. Ozone exposure produces distinct visible foliar injury on these plants that is easy to identify. A network of ozone biomonitoring plots (currently maintained by the FIA program) has been set up across the U.S. in open areas containing ozone-sensitive species. Because it would be very difficult and expensive to monitor the damage to leaves at the tops of trees, FHM instead samples the foliage of ozone-sensitive herbs, shrubs and trees growing in open areas near the forest. The damage found on these bioindicator plants reflects the damage that ozone may be having on trees in the region.
A plot-level index was calculated based on the amount and severity of ozone damage to the leaves of each plant and the number of species evaluated at each site. The plot data were then used to calculate the average ozone biosite index for ecological regions of the U.S. Based on analyses presented in the Forest Health Monitoring 2003 National Technical Report (Coulston and others 2005b), ozone-induced foliar injury to bioindicator plants occurred more frequently in the Eastern U.S. than in the West from 1997 through 2001.
There is not yet any evidence linking FHM ozone bioindicator response data to a specific tree health problem or a regional decline. Nevertheless, the mapped data demonstrate that plant-damaging concentrations of ozone air pollution are widespread in parts of the landscape. Continued monitoring and analysis will be important when determining probable or significant ozone impacts.
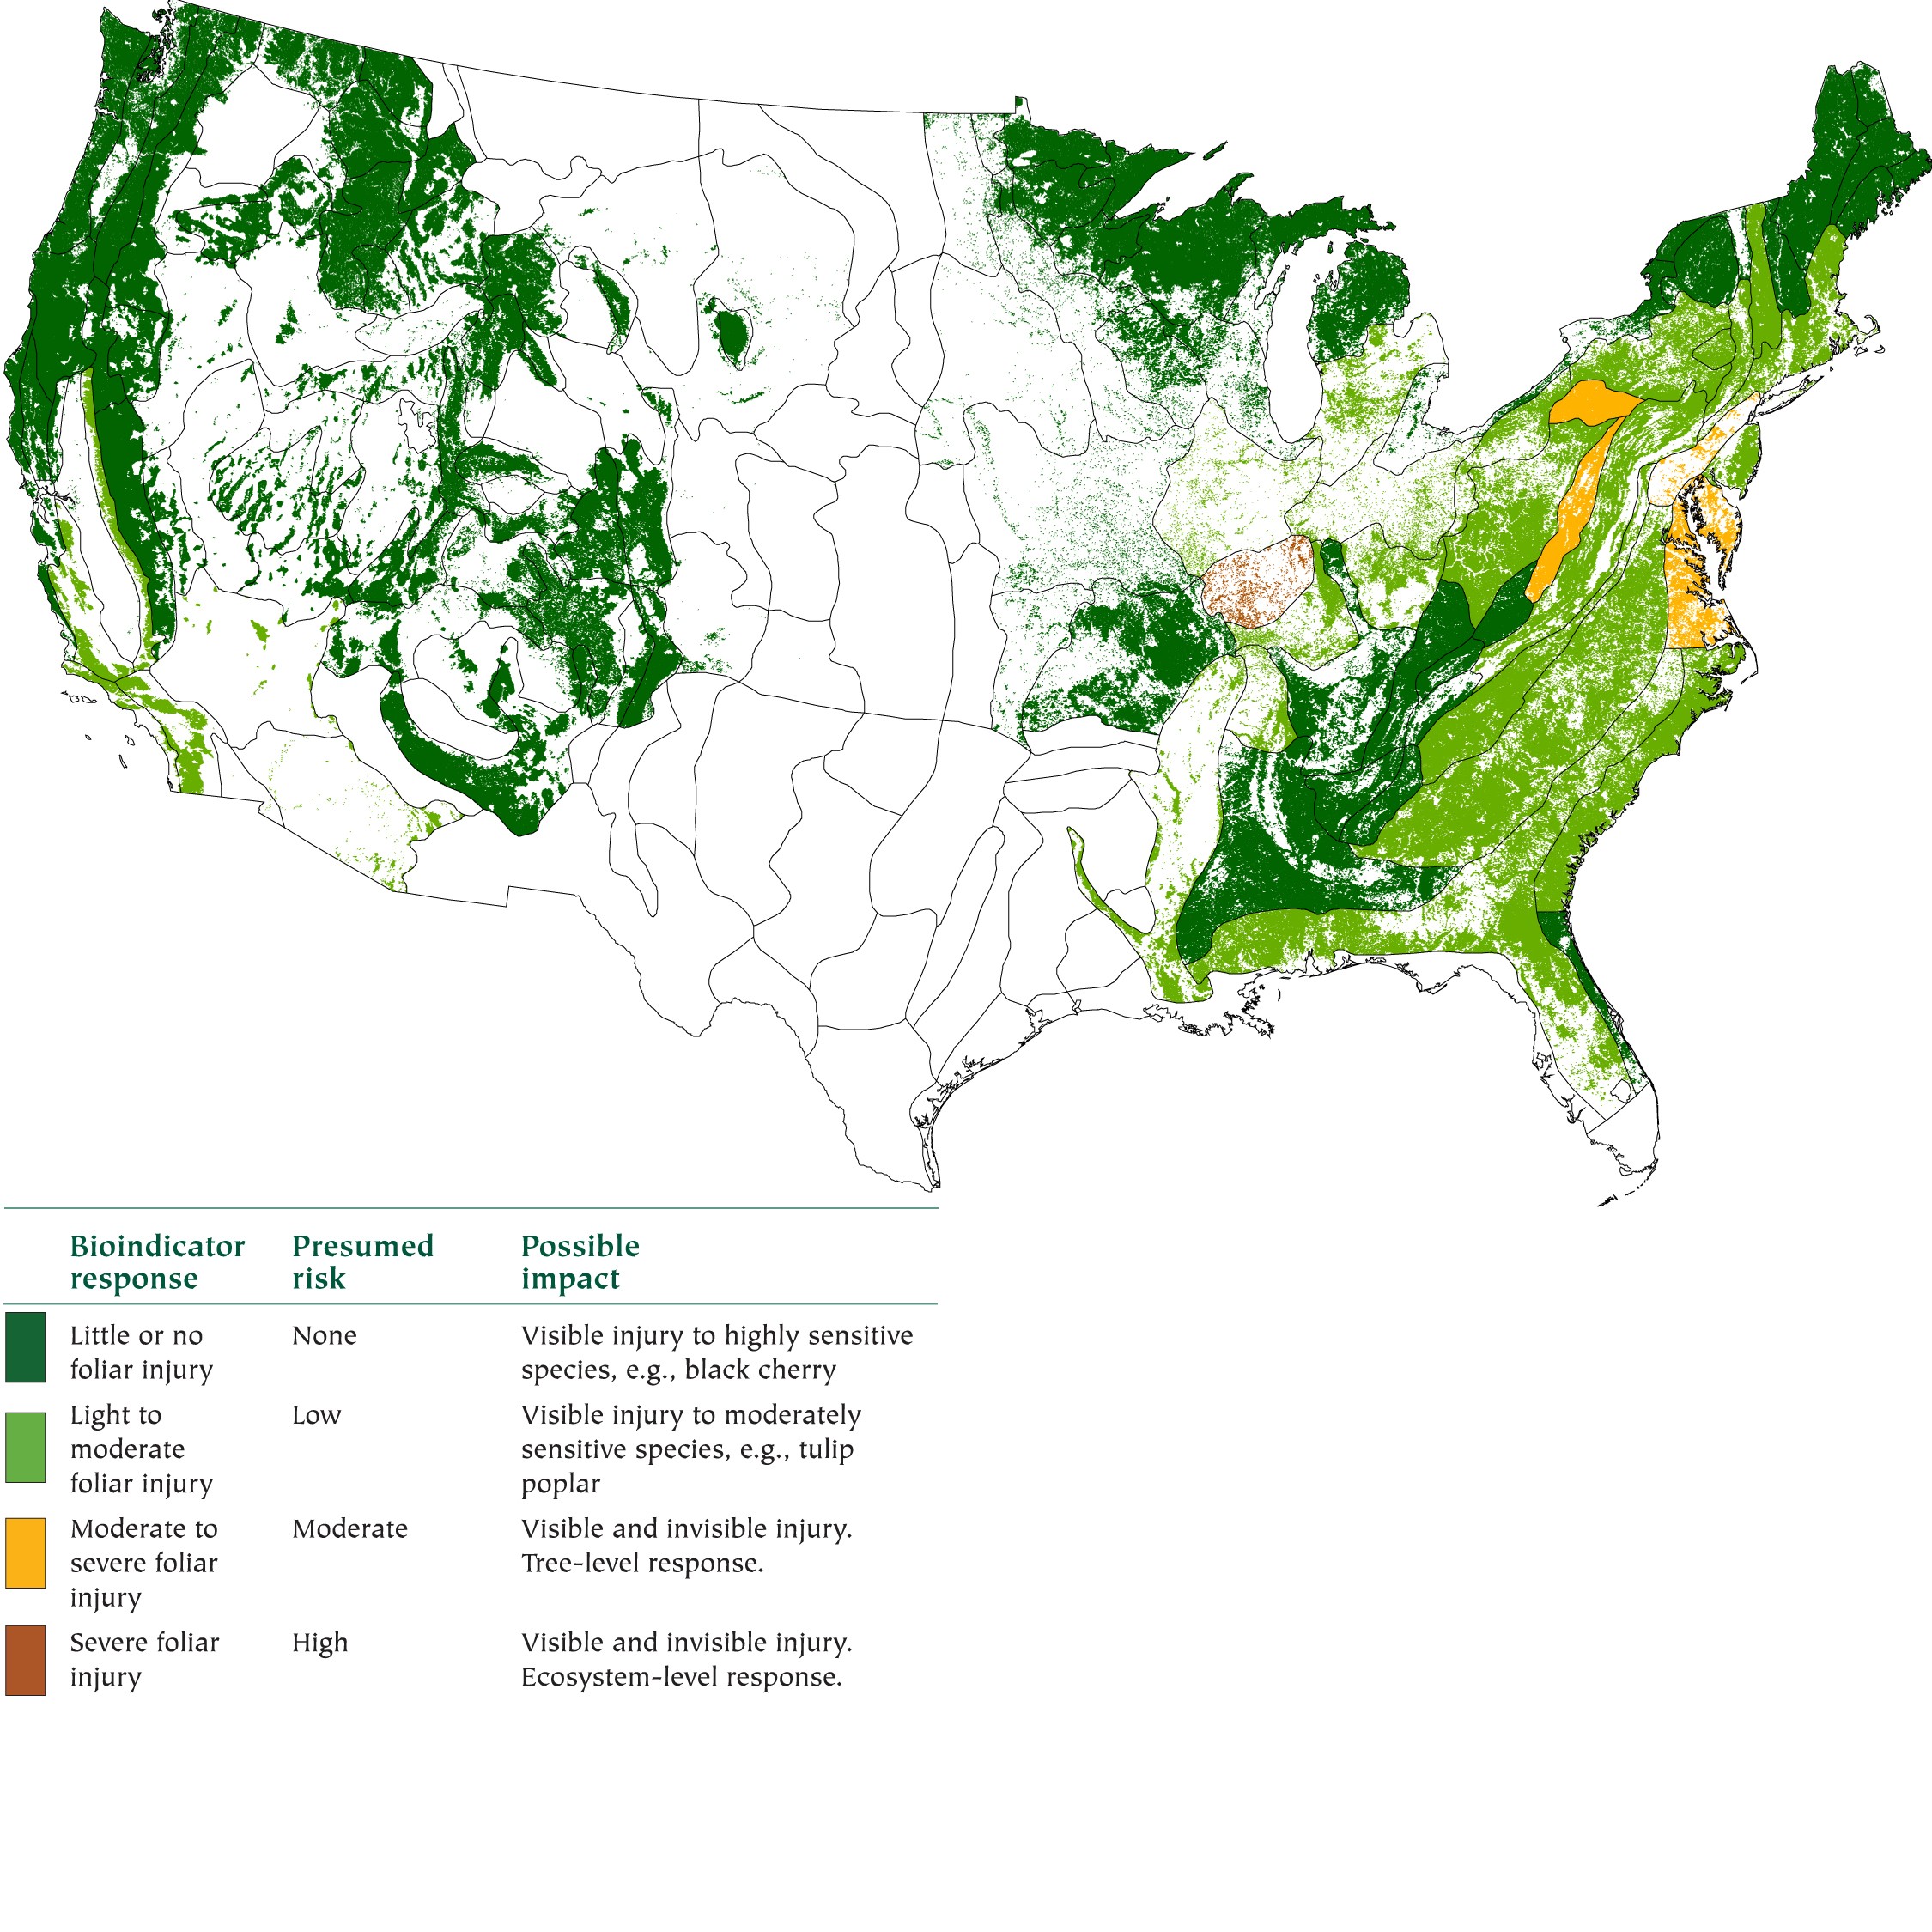
Figure 2. Average annual (1997 to 2001) biosite index by Bailey's ecoregion section (Bailey 1995, McNab and Avers 1994). Forest cover is derived from Advanced Very High Resolution Radiometer (AVHRR) satellite imagery (Zhu and Evans 1994). (Map from Forest Health Monitoring 2003 National Technical Report)
