
Mortality
Tree mortality is a natural process in forested ecosystems, and mortality rates can be expected to vary with forest type and region of the U.S. Therefore, mortality does not always indicate a forest health problem. However, very high mortality rates or unexpected changes in tree mortality can indicate possible forest health issues.
Using available FHM and FIA plot data through 2002, tree mortality was analyzed relative to tree growth rates. For each ecological region the MRATIO, which is the ratio of annual mortality volume to annual gross growth volume, was calculated. The MRATIO can be large if a forest stand is senescent and losing many older trees. If forests are not naturally senescing, a high MRATIO (> 0.6) may indicate high mortality due to some acute cause (insects or pathogens) or generally deteriorating forest health conditions. When MRATIO is greater than 1, mortality exceeds growth, meaning that live tree volume is decreasing.
Mortality estimates from the Forest Health Monitoring 2004 National Technical Report (Coulston and others 2005c) identify a few ecological regions that had an MRATIO greater than 0.6, indicating that the loss of trees relative to growth is fairly high, but the majority of areas for which there were data did not have a high MRATIO (fig. 3). Possible causes for high mortality in particular regions (for example fire or insects) are presented in the full national report.
These mortality results are based on a coarse, national scale analysis used to make broad comparisons of forest condition across the U.S. They can give a general indication of forest vigor and potential problem areas. The results must always be interpreted in the context of the typical forest stand age and management regime in any given region. For example, in a region of mostly old-growth forest, one would expect to see an MRATIO of about 1 because in old-growth forests, growth is about equal to mortality. However, an MRATIO of 1 would indicate potential forest health problems in a region of mostly young, even-aged forest stands.
The value of this approach to analyzing mortality will increase as data are collected over longer time periods and we can analyze any long-term trends. It is our hope to apply this approach to finer scale forest inventory data being collected by FIA to produce improved estimates in the future.
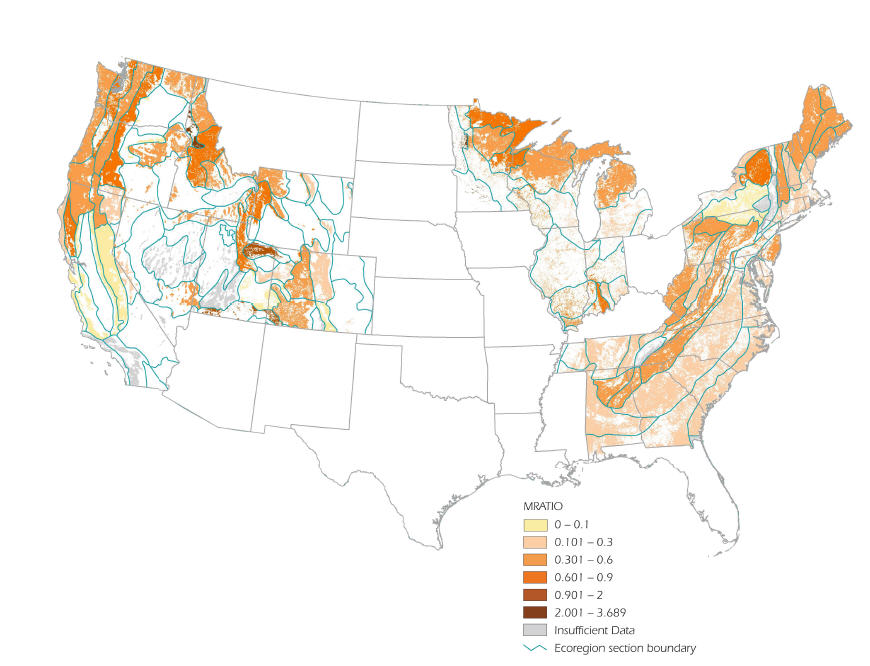
Figure 3. Tree mortality expressed as the ratio of annual mortality volume to annual gross growth volume (MRATIO) by Bailey's ecoregion section (Bailey 1995, McNab and Avers 1994). The States with no color are States for which there were no data from remeasurement of the plots as of 2003. Forest cover is derived from Advanced Very High Resolution Radiometer (AVHRR) satellite imagery (Zhu and Evans 1994). (Map from Forest Health Monitoring 2004 National Technical Report)
The analyses presented here are explained in greater detail in the cited FHM National Technical Reports. These reports are available on the Web at: www.srs.fs.usda.gov/pubs. Printed copies of the reports may be requested by writing to:
Science Delivery
U.S. Forest Service
Southern Research Station
200 W.T. Weaver Boulevard
Asheville, NC 28804-3454
or by sending email to: pubrequest@fs.fed.us
<--Previous page Next page -->
