
Forest ThreatNet
Plants Feed Healthy Forests
VEG indicators expand long-term forest health research
By Karin Lichtenstein, NEMAC
Who owns America’s forests? How many acres of forest are out there? How healthy are they? Imagine trying to answer these questions….Now think about changes that forests continually face due to disease, insects, fire, and multiple other challenges that exist. Obviously, these questions can become very difficult to answer.
Difficult to answer, but not impossible. Forest Inventory and Analysis (FIA) has tackled these questions since 1928, when researchers began conducting systematic inventories of the nation’s forests. Recently, they joined forces with several EFETAC scientists and other partners who are helping to expand these inventories to include forest health indicators—one of which is Vegetation Diversity and Structure (VEG).
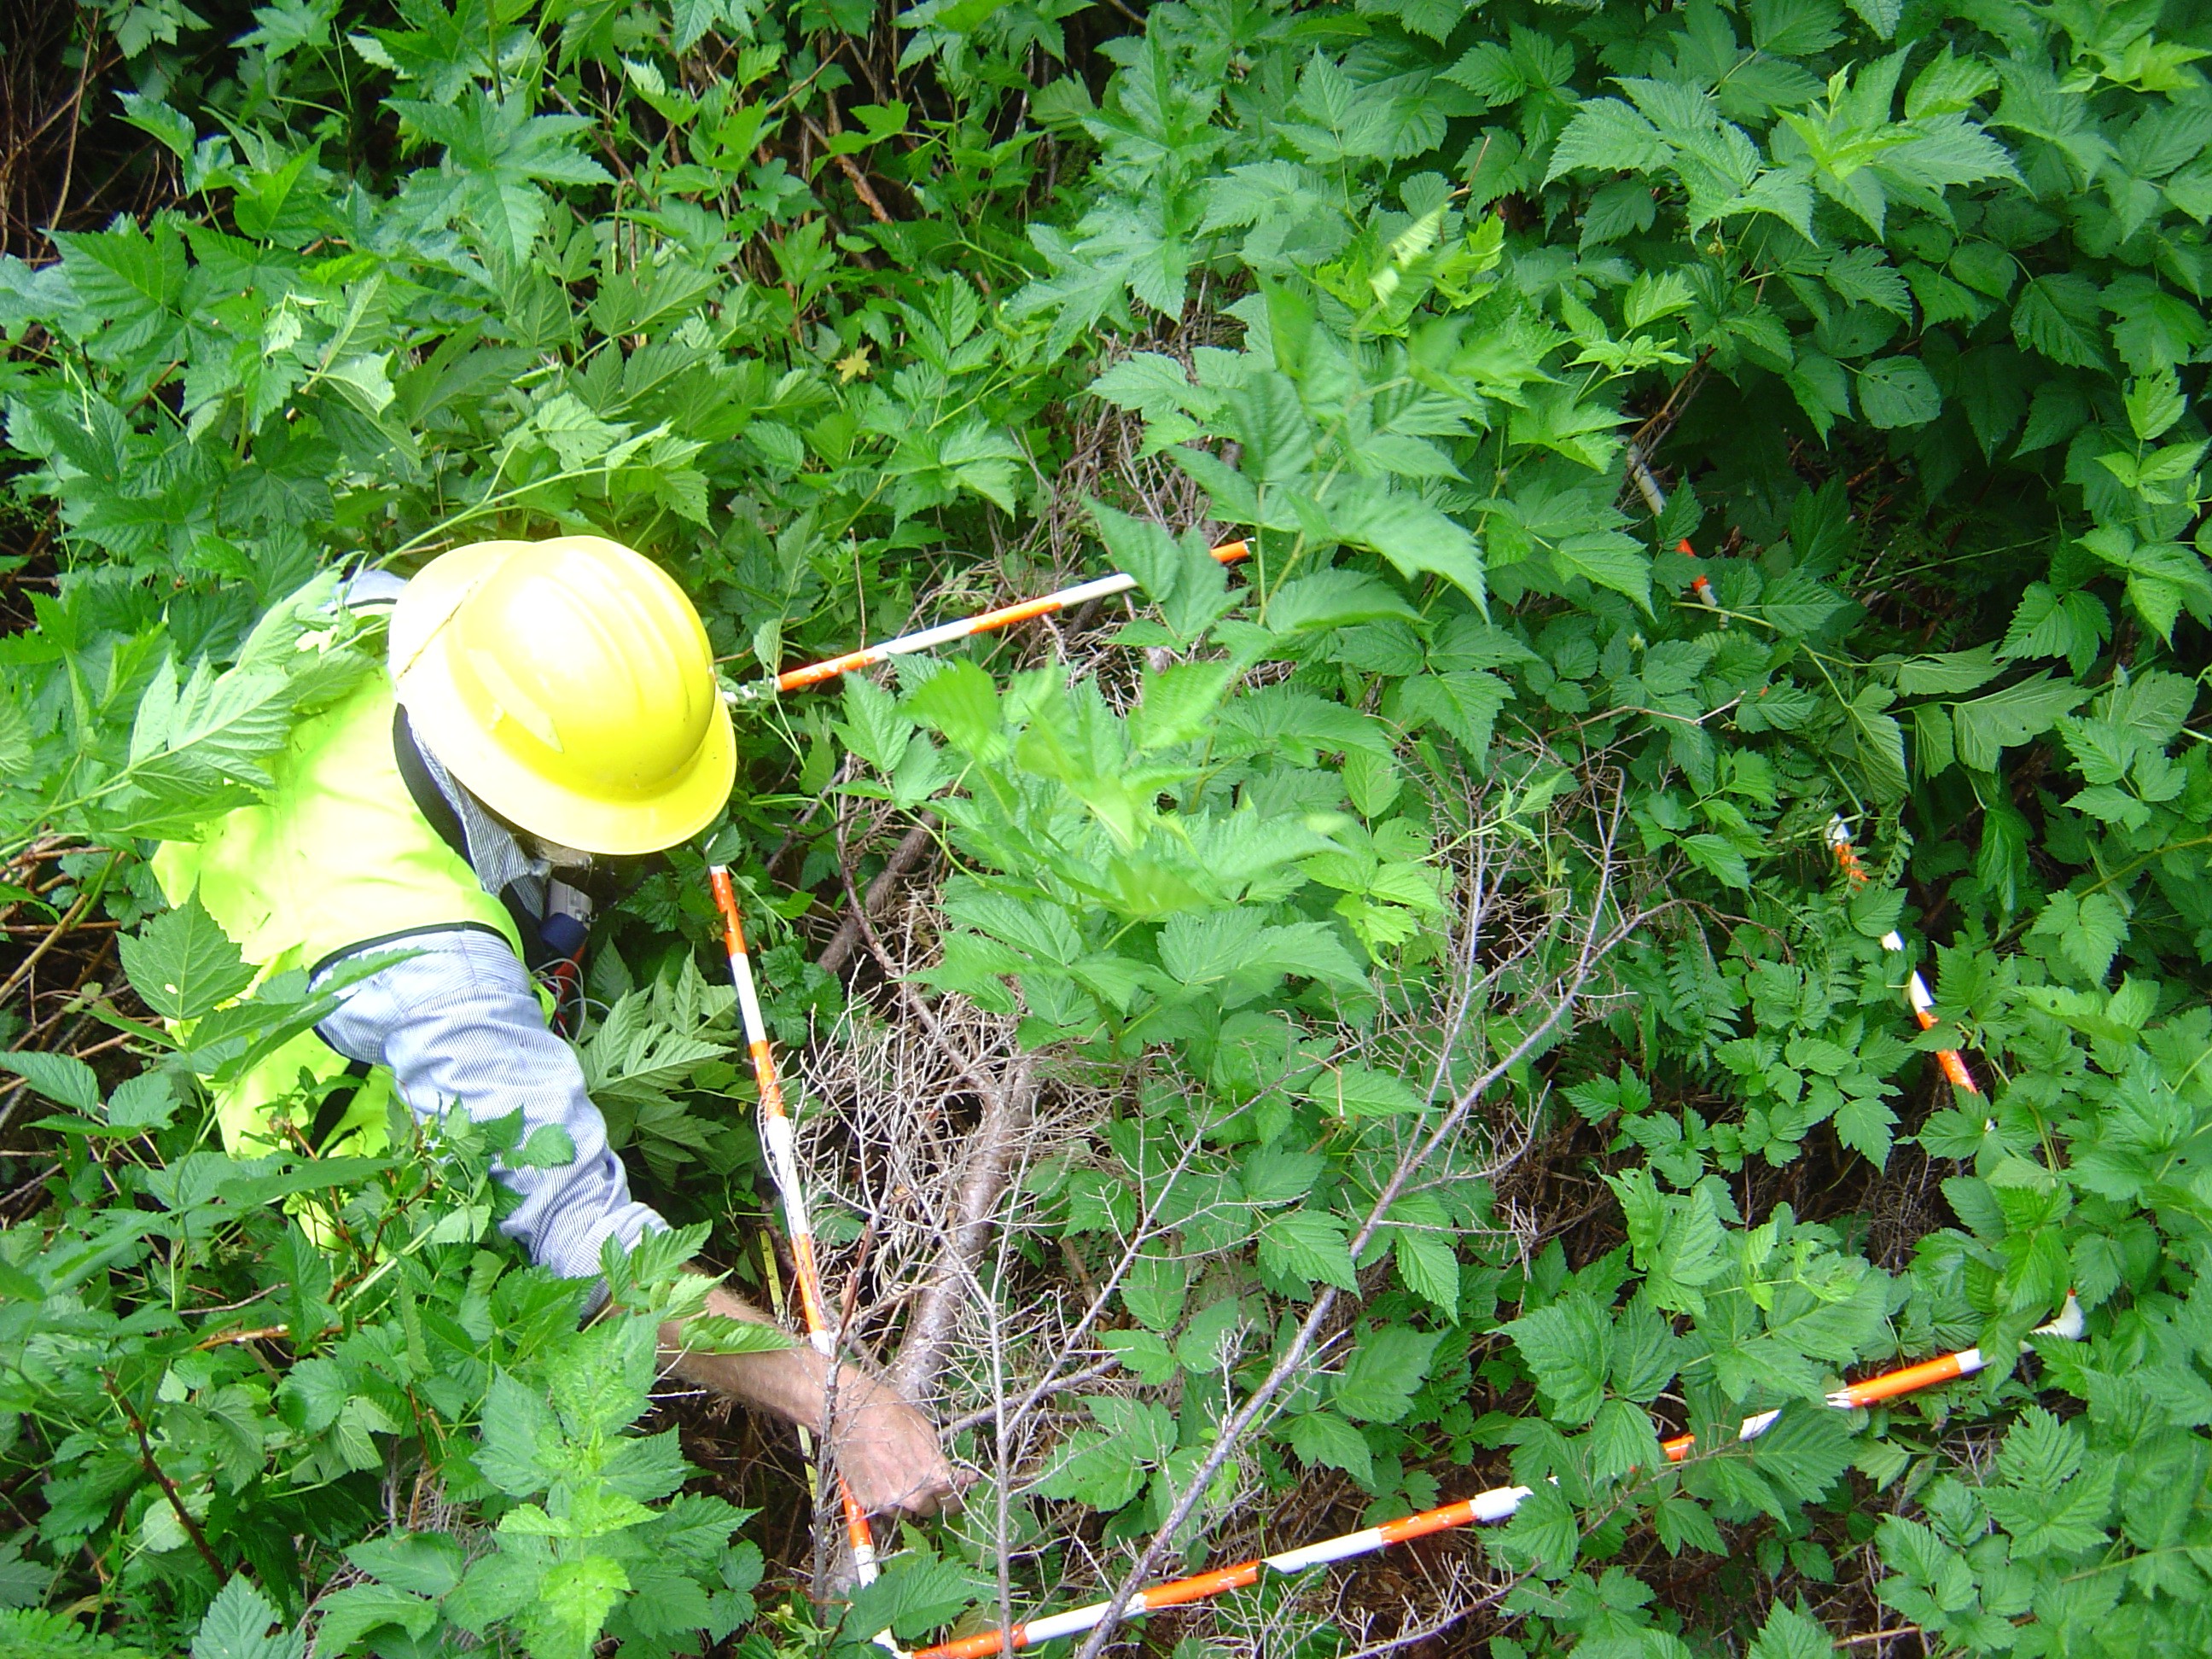
 This indicator, which was initially implemented by Forest Health Monitoring (FHM) in the 1990’s, has undergone many changes and improvements over the years. By adding VEG to the FIA sampling network, it is now possible to estimate the type, amount, and vertical structure of all vascular plants across the entire landscape. Vascular plants include the entire tree and understory plant species in the forest (e.g., trees, ferns, flowering plants). Pacific Northwest Research Station and Anchorage-based research ecologist Beth Schulz explains that vascular plants are “a major source of primary production—the conversion of sunlight energy into stored organic matter—and a fundamental determinant of wildlife habitat and wildfire fuel characterization.”
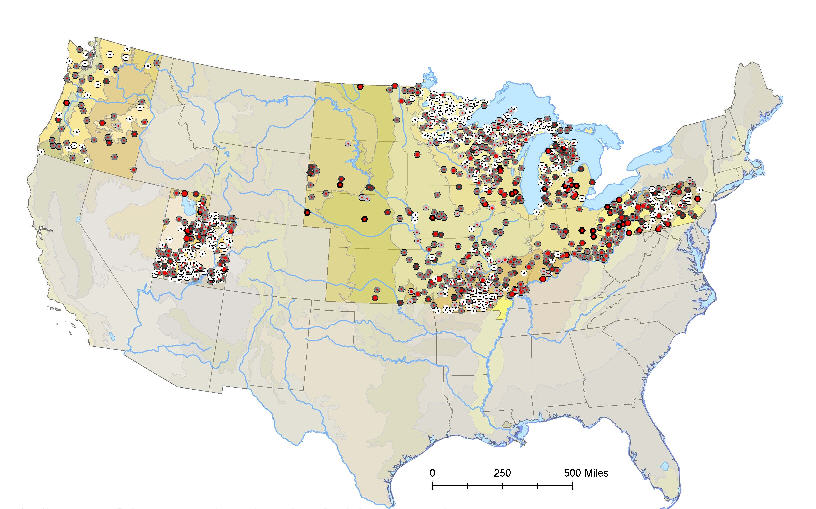
Above: Map shows plot allocations and makes available percentage and relative proportion cover of introduced plant species.
Consistent sampling and analysis methods employed by VEG facilitate identification of trends over time and across the many different forest types in the United States. Schulz says the VEG indicator can teach a lot about trends in forest plant species richness and composition, the relative abundance and spatial distribution of those plants (including native and non-native species), as well as the overall physical structure created by plant species.
 EFETAC’s FHM team leader Bill Bechtold adds, “The VEG indicator is unique in that this is the first attempt to sample all vascular plants to be successfully implemented at the national scale.” Schulz, Bechtold, and Southern Research Station biometrician Stan Zarnoch just completed an important technical report describing in detail sampling and estimation procedures on which the VEG indicator is founded (Schulz and others, in press).
The publication is intended as a reference to guide FIA analysts, statisticians, and other researchers in the processing and interpretation of VEG data. Subsequent reports based on VEG data will enable policymakers and land managers to better understand the role vegetation plays in ever-changing forests. Schulz notes, “Disturbances in vegetation can have cascading effects through an ecosystem, whether the changes are brought about gradually through natural succession or by sudden destructive forces.”
« Previous page Next page » Return to contents
