
Using forest phenology to understand landscape change
The Landscape Dynamics Assessment Tool, or LanDAT, is designed to help natural resource managers assess changing landscapes and understand how landscape change impacts ecosystem services. LanDAT relies on vegetation phenology, or the normal biological change that vegetation undergoes across the annual cycle, to map forest changes driven by agents such as fire, land use, insects, disease, and climate. Phenology mapping provides new tools for smart resource management in the context of landscape change.
 Land management objectives and ecological realities differ from place to place, but all forest lands face threats stemming from land use change, climate change, and disturbances such as wildfire, forest pathogen outbreaks, and invasive species. Informed management decisions benefit from ways to define and measure landscape change and resilience through time. SRS researchers have developed tools that monitor all lands across the conterminous U.S. and adjacent Canada and Mexico, providing a comprehensive year-to-year perspective on landscape dynamics.
The key insight of LanDAT is that phenology (regular seasonal change) is an excellent indicator for basic variation in ecosystems, as well as changes in basic ecosystem characteristics wrought by multiple interacting stressors on forest vegetation. Vegetation phenology can be observed in satellite imagery, making it possible to map such changes across large areas. This provides managers with a new tool for seeing landscape change and assessing the influence of management activities on landscape resilience and adaptive capacity. LanDAT is accessible through a public website, map viewer, and story maps.
A recent article in the journal Forests details the methods used to transform long time series of satellite images into phenology metrics that reveal patterns of landscape change in new ways.
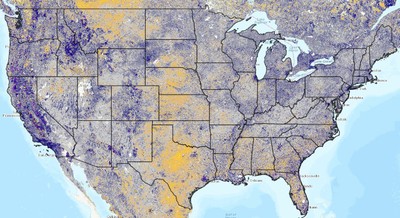
Pictured: The Landscape Dynamics Assessment Tool features a map viewer that visualizes vegetation phenology and its dynamics through time. This example shows the direction of landscape change in growing season productivity over nearly two decades—increase is in yellow, loss in blue. Local changes related to land use, and regional changes more likely related to climate, are visible. USDA Forest Service image.
Related publications:
Contact: Lars Pomara, Eastern Forest Environmental Threat Assessment Center, lazarus.y.pomara@usda.gov.
