
Mapping crops in near real time across the United States
The ability to map agricultural crops using satellite data may permit the near real-time monitoring of their health and vigor. SRS scientists and collaborators are researching ways to automate a process that achieves this and integrate it into an online, publicly available system like the USDA Forest Service’s ForWarn. If ForWarn could be expanded to include crop maps, crop health could be monitored nationally every eight days, along with the health of forests and rangelands.
 Farmers, agricultural extension agents, and others need near real-time information about the health and vigor of crops. A collaboration among SRS scientists and researchers at Northeastern University and Oak Ridge National Laboratory is leveraging satellite data to map crops across the continental US as they grow. Their research links satellite images of croplands to ground truth data from the USDA Cropland Data Layer (CDL). The team used a long record of MODIS satellite images to describe characteristic changes in cropland NDVI, a measure of vegetation greenness that can indicate the type of crop planted. They identified and grouped crop areas whose greenness patterns through time were similar into phenoregions, because their recurring seasonal behavior (phenology) is distinctive. Crop labels were then given to phenoregions by matching them to known crop classes from the CDL. The researchers used region-specific ecological information to reduce errors caused by variations from climate, agricultural practices, and growing conditions. The satellite-based system showed about 70% accuracy for identifying eight major crop types for the major corn, soybean, and winter wheat producing areas, with accuracy reaching 90% of year-end accuracy by the end of August. The system could eventually make near-real time information about changes in crop status available at the national scale, providing a new resource to help farmers and others respond to changing conditions and stressors.
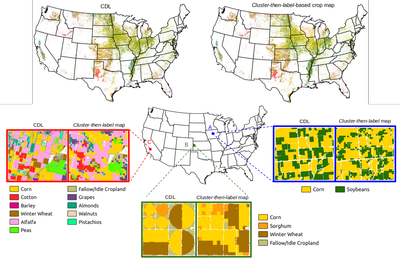
Pictured: Satellite-based classification of major agricultural crops. Corn Belt (A, right), winter wheat (B, center), and more diverse cropping systems with small fields (C, left) all show broad agreement with known crop types (CDL, the USDA Cropland Data Layer). While CDL resolves the field boundaries well, the MODIS-based map shows them in coarser resolution. USDA Forest Service image.
Related publications:
Data products: data products from this study are publicly available, including annual national crop type maps from 2000–2018. This includes CDL-like national crop maps for seven years before the first CDL map was produced in 2008.
External Partners/Collaborators: Forrest M. Hoffman and Jitendra Kumar, Oak Ridge National Laboratory, Oak Ridge, TN, USA; Venkata Shashank Konduri and Auroop R. Ganguly, Northeastern University, Boston, MA, USA
Contact: William Hargrove, Eastern Forest Environmental Threat Assessment Center, william.w.hargrove@usda.gov.
