
consistent national data across satellite sensors provides historical perspective for forest disturbance
Multiple past years of information are needed to interpret the ecological impact of present-day forest disturbances. When a new satellite sensor is launched, it may have improvements, but it will be different from the last satellite sensor that we have been using for many years to monitor vegetation change. To create a long-term data set that is consistent across sensors, we need a statistical process to harmonize them.
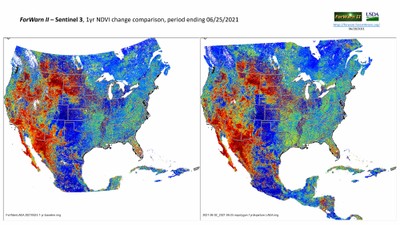 ForWarn is a national system created by Forest Service scientists as an early-warning system that can detect vegetation disturbances in near-real time. However, interpreting the impact of ongoing forest disturbances requires the perspective of a baseline historical archive going back 10 years or more. As older satellite systems reach their end-of-life, ForWarn has been re-designed to utilize data from the newer Sentinel-3 sensors onboard satellites launched by the European Space Agency. But the Sentinel-3 satellites were only launched about four years ago. To harmonize the new with the old, Southern Research Station scientists developed a statistical method to transform historical MODIS satellite maps of the widely used NDVI vegetation index into “Sentinel-3-like” NDVI maps, even for time periods before the Sentinel-3 satellites were launched. The team developed and used a set of special, customized statistical ecoregions, called “phenoregions,” to define vegetation types across the USA. They then developed a customized translation between MODIS and Sentinel-3 NDVI within each of the 500 phenoregions. These phenoregion-specific translations removed geographic bias in how the method performed, improving results particularly in ecosystem types that are sensitive to such bias. This process creates a consistent, long-term, national data set for monitoring vegetation every 8 days, which can now be relied on into the future.
